THE “CORONA” CONUNDRUM
On 11 March 2020, WHO declared Novel Coronavirus Disease (COVID-19) outbreak as a pandemic and reiterated the call for countries to take immediate actions and scale up response to treat, detect and reduce transmission to save people’s lives. As a result, across globe, nations have taken steps to implement social distancing to reduce the transmission rates. On 24 March 2020, India implemented a 21-day nationwide lockdown. As on 8 April 2020, over 4700 COVID-19 cases, have been reported in 29 states/union territories in India.
How did it grow like that?
Is there a method or model which can explain this so called exponential outbreak?
Exponential curves are like compound interest, they don’t let you feel whats coming up unless you go ahead a bit for some time and then you see it just taking off! Unfortunately entire world is witnessing this outbreak and every day is presenting a number which is even more disastrous than before.
This article is based on my research on modelling the ongoing pandemic mathematically so as to understand what is going on and what lies ahead. More importantly, if it is going to get this bad, what do we do to contain the outbreak and how do we do?
WHY DEVELOP A MODEL?
Any model can be typically thought of as a conceptual tool that explains how a a system will behave. A mathematical model uses the language of mathematics to produce a more refined and precise description of the system. In epidemiology (Study of Epidemics), models allow us to predict the population-level epidemic dynamics from an individual-level knowledge of epidemiological factors, the long-term behavior from the early invasion dynamics. These models dramatically facilitate strategic planning and assist in foreseeing outcome of actions which otherwise is difficult to imagine due to so-called non-linear complexities of real-world problems.
MODELLING AN EPIDEMIC MATHEMATICALLY
The progress of an infectious disease involving a virus is defined qualitatively in terms of the level of the pathogen (virus) within the host(the infected), which in turn is determined by the growth rate of the pathogen and the interaction between the pathogen and the host’s immune response. The abundance of the parasite grows over time & develops the potential to transmit the infection to other susceptible individuals; the host is infectious. Finally, once the individual’s immune system has cleared the parasite and the host is therefore no longer infectious, they are referred to as recovered.
This fundamental classification (as susceptible, infectious, or recovered) solely depends on the host’s ability to transmit the pathogen. This implies that the disease status of the host is irrelevant—it is not important whether the individual is showing symptoms.
This disease profile can be mathematically modeled as SIR (susceptible-infectious-recovered). These are also referred to as compartments where people are, some are in S, some are in I and some in R and at any point all put together is the population. Of course this neglects the births and deaths because the outbreak is much rapid and more dynamic than those vital statistics.
![]()
A crucial issue in the study of the spread of an infectious disease is how it is transmitted, which depends on both the population behavior and the infectivity of the disease. Mathematically, these two aspects are captured in the rates by which people from S(Susceptible) go to I(Infectious) and from I to R(Recovered). These rates are parameters which govern the dynamics of the epidemic and they vary from region to region basis demographics, social structures, etc. Once these parameters are reasonably estimated, one can establish the Mathematical Model, as introduced above, the SIR Model which was originally proposed by Kermack and McKendrick in 1927. With the phenomenal computing power and highly developed scientific programs like Python & R that we have today at our disposal, one can solve these complex mathematical models to get the dynamic model. In fact during the course of the study, it was surprising to see its just over past few years that a lot has been done in this area. Perhaps driven by the surge of outbreaks over recent past and facilitated by modern technology.
WHAT THE MODEL SAYS?
Well the model does yield a scary scenario with over 100 Mn infections possible without any intervention. My research however was intended towards finding out how do we control, rather than predicting the outbreak peak. To understand this, I developed a simulation model by factoring in Lockdown Scenarios. Fundamentally Lockdown and Quarantine are age old yet pretty effective ways to control a pandemic and it is obvious intuitively as well. The questions arises, how long it should be and how strictly it should be enforced.
Mathematically, I modeled the lockdown scenario by assuming a reduced transmission rate and also varying it over a range to simulate strictness of the Lockdown. A stricter and stringent lockdown will lead to a lower transmission and vice- versa. Also, the simulator was designed to incorporate duration and number of lockdowns. Let us now look at some of the results from the simulation and see what mathematics has to say.

The image above is the complete SIR Model which shows a peak of close to 0.2Bn. This is the case without any intervention to control the outbreak. (Pretty Scary!)
The Image below shows you the prediction (Blue line) vs the Actual COVID cases reported (Orange Dots). Note that there might offset between prediction and actual which actually indicates the lag in number of cases reported, which is another problem related to inadequate test capabilities. In fact, given the fact that initial number of tests performed are too less for the population, the actual cases would be much higher, the ongoing lockdown and its effectiveness should not be interpreted from any flattening (reduction in counts) if observed.

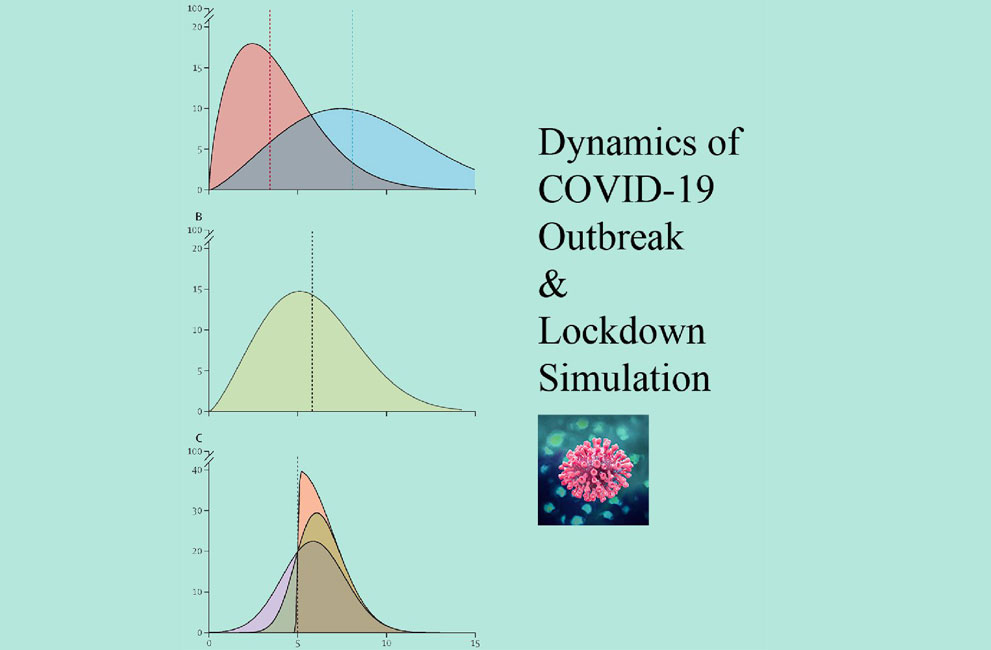
This image below shows that a 21 day lockdown turns out to be ineffective and a resurgence of outbreak is immediately seen. See the blue line surging up & immediately crossing 4 Mn mark, though far less than the case when there was no intervention.

The image below shows the effect of 2 lockdowns of 3 weeks with one week gap. There still, a resurgence can be seem, though less than the previous case. In both these cases a moderate reduction in transmission rate of infection was assumed (about 1/3rd of normal transmission rate).

Even 2 moderately controlled lockdowns are ineffective in containing the outbreak!
Let us look at the result when it was assumed a very strict lockdown with tight controls by authorities, mathematically same was simulated by assuming a reduction in transmission rate by 1/10. This nails it down and contains the outbreak.

2 Strictly implemented Lockdowns of 3 weeks with a gap of 1 week successfully contains the Outbreak!
The scenario will also improve because of the fact that it lowers the number of victims by orders of magnitude and reduces the burden on the healthcare system to an acceptable level. This will also inhibit the transmission rate and this gradual “flattening” will make the outbreak “manageable” and “contained”.
CONCLUSION
Perhaps the most obvious conclusion of this analysis is that a preventative lockdown in a strict manner must be preferred over a relaxed lockdown as it dramatically crushes the peak down and hence lowers the burden on the healthcare system. It bis also evident from this research, how effectively this model and for that matter, in general, models can aid in qualitative understanding and quantitative prediction but of course it should not be used in isolation and must be considered with a system view by integrating, political, economic & social views as well.
UNDERLYING RESEARCH
This article is the derivative of my research on the subject, the resultant paper is available at this LINK, published by International Journal of Statistics and Applied Mathematics 2020; 5(2): 95-101.
NERD SECTION
For the Nerds out there, here are some of the statistical/mathematical jargons related to the simulation.
The Goodness of fit was tested using cor.test in R yielding very satisfactory results: Cor Coeff of 0.976, p-value < 2.2e-16, Data Source for study was forked from John Hopkins CSSE GitHub repository.
MATHEMATICAL MODEL
The image on the right is the SIR Model in the form of ordinary differential equations. and the blue equations are the solution of the same.

TECHNOLOGY
The model was implemented in R and deployed on cloud with Ubuntu on Shiny Server. The Interactive Simulator is made available to public for study at the link below. Feel free to explore and reach out for any query.
LIVE SIMULATION: CLICK HERE